Even in the midst of a prolonged economic expansion with a low national unemployment rate, jobs are not always available and not everyone who wants work can find it. Both job availability and demographics vary markedly around the country, yielding diverse local populations wanting and/or needing work.
This analysis aims to deepen understanding of out-of-work Americans, and support local officials in their efforts to help these individuals find jobs. We provide a unique perspective on adults ages 25-64 who are out of work in each of 130 large cities and counties across the United States, using cluster analysis to segment the out-of-work population into distinct groups based on factors such as educational attainment, age, work history, disability, English language proficiency, and family status. We present detailed information on these groups accompanied by information on appropriate and effective workforce development programs in order to help local officials, funders, and other stakeholders develop, strengthen, or diversify strategies to connect their residents to employment.
Defining the out-of-work population
In the 130 study jurisdictions, there are 78.9 million adults ages 25–64 who are civilians and not living in institutional settings such as correctional facilities. This bar represents that entire group.
Of this 78.9 million, 4 million are unemployed—people who do not have a job, are available for work, and have actively looked for work in the last four weeks.
An additional 16.2 million are considered not in the labor force—people who are neither working nor looking for work. This is a heterogeneous group with different reasons for not entering the labor force, not all of which are readily observable. Individuals may be devoting time and energy towards other activities such as raising children, taking care of other family members, or going to school. They may be retired or have disabilities that preclude employment. They may be interested in working, but because they have not searched for a job in the past four weeks, they are not counted among the unemployed.
Of the combined unemployed and not-in-the-labor-force populations, our goal is to identify those most likely to be interested in or benefit from workforce development assistance. Therefore, we subtracted the following groups: people receiving retirement and disability benefits, most students, and our best estimate of people who choose to be stay-at-home parents with sufficient earnings from a spouse who works. These subtractions amount to 10 percent of the unemployed and 53 percent of those not in the labor force.
This leaves 11.3 million individuals defined as out-of-work (14 percent of the 25–64 year-old non-institutionalized civilian population.)
Place matters
Cities and counties do not all fare equally in the global economy, nor do their residents. Local conditions and interventions play a pivotal role in connecting job seekers to employment opportunities, and most of the responsibility for executing on this goal rests with local officials and leaders in the public, private, and social sectors.
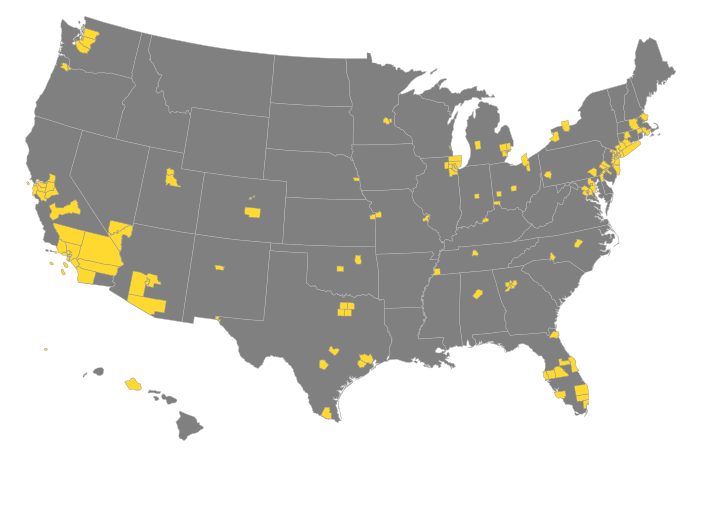
![]() Jump to jurisdiction data
Jump to jurisdiction data
The 130 jurisdictions included in the analysis collectively account for nearly half (48 percent) of the nation’s population aged 25-64. The study jurisdictions include large cities with populations upwards of 1.5 million, such as Los Angeles, Chicago, Philadelphia, and Phoenix; mid-size cities such as Albuquerque, Milwaukee, Louisville, and Nashville; and high-density counties with populations over one million near the core of large metropolitan areas (Alameda, CA; Fulton County, GA). They also include lower-density counties with populations under one million (Montgomery County, OH; Anne Arundel County, MD), including some with rural characteristics (Lancaster County, PA; Fresno County, CA). Although they all pass the 500,000 population threshold, in other words, they show substantial variation in size and other characteristics.
Segmenting the out-of-work into groups based on shared characteristics
The question of what works best in workforce development is more usefully conceptualized as a narrower question: what works best for whom? While successful programs have common elements, they typically tailor key components—the intensity, length, and specific focus of services—to the needs and circumstances of the people they are serving.
Someone with less than a high school diploma needs a different educational program than someone who enrolled in college but dropped out without a credential. Someone with relatively steady work experience probably does not need an orientation to the culture of work as might someone with a sporadic work history; and factors such as limited English proficiency, child-care responsibilities, and criminal backgrounds are issues that programs must address to help participants successfully increase their skills, find a job, and chart a path to higher earnings.
We used cluster analysis to segment the out-of-work population into groups of individuals with similar attributes in order to better identify what kind of help they might need to find employment. We identified 828 clusters across the 130 study jurisdictions, which together roll up into 7 major groups.
Effective practices to connect out-of-work groups to employment
Broadly speaking, effective workforce programs offer training that aligns with regional labor market needs and provide guidance, counseling, and other appropriate supportive services to participants. We reviewed the research literature and identified eight approaches shown to be effective by formal evaluations, preferably with random assignment techniques in order to identify causality. These approaches disproportionately target people with lower levels of education, reflecting the general orientation of the field of workforce development.
While our focus on formally evaluated programs adds to our confidence in their effectiveness, it also reduces the number of programs we list. Because third-party evaluations are complicated and expensive, they are undertaken by a minority of programs. There are gaps in the research literature about how best to serve specific groups, such as older individuals, the long-term unemployed, and people with very low literacy and English language skills. This is not to say that there is no practical knowledge base about how to serve these groups, but rather that the field would benefit from a stronger emphasis on documenting and disseminating effective practices. In short, our list should be viewed as a point of departure, not a comprehensive inventory.
![]() Click or tap on any of the blue dots below to view more information about these programs.
Click or tap on any of the blue dots below to view more information about these programs.
BP
Bridge programs prepare people with low academic skills for further education and training, sometimes in combination with occupational skills training.
TJ
Transitional jobs programs provide short-term subsidized employment and supportive services to people with limited work experience and barriers to employment, and help participants find unsubsidized jobs.
SE
Social enterprises are mission-driven businesses that hire people with limited work experience and barriers to employment to carry out the work of the business. The enterprise also provides supportive services to workers and helps them find other employment opportunities.
JS
Job search assistance and counseling is a central feature of the public workforce system’s American Job Centers and other employment programs. It consists of in-person and individualized assistance, including skill and interest assessments, career and training planning, case management and referrals, and help with resume preparation and interviewing skills.
SI
Sector initiatives identify employers’ skill and workforce needs in a given industry and region and develop recruiting, assessment, and training strategies to help employers find workers with the right skills.
2G
Two-generation programs link education, job training and career-building for low-income parents with early childhood education for their children, thus building human capital across generations.
AP
Apprenticeships combine paid employment with on-the-job training and related classroom instruction.
AS
ASAP (Accelerated Study in Associate Programs) was designed by the City University of New York to increase the graduation rate of low-income community college students seeking an Associate degree. The program requires students to attend full-time and provides a range of academic, financial, and personal supports.
Explore the seven major out-of-work groups
The programs listed as effective for each group are meant as guidelines. Not every program is a good fit for every member of a given group. For instance, a program matched to a group including both people with and without a high school diploma may be best suited for high school graduates. Or a program may require a threshold of literacy and math skills that not everyone may have, even if they are in a group with some post-secondary education.
Overview
Nearly all members of this group are under age 35. It is the most racially and ethnically diverse group, and has the highest rate of caring for children in the household—many with children under age 6—and single parents. At the same time, this group has the highest rate of young adults living in their parents’ home. Members have at most a high school diploma (or equivalent), and 41 percent have not completed high school. Median family income is $30,753, the lowest of any group; and 58 percent receive safety net support. More than one-third are actively looking for work.
Effective practices for this group![]()
BP
TJ
SE
JS
SI
2G
AP
AS
Meet Patricia and Will

Patricia is a 25-year-old single mother who did not finish high school. She has never worked, instead caring for her young children and several nieces and nephews. Now that her children are school-age, she is looking for work outside the home. She is not a citizen and speaks Spanish at home.

Will is a 30-year-old black man with a high school diploma who lost his warehouse packaging job nearly a year ago; he stopped looking for work several months ago. He is unmarried and recently moved back in with his mother.
Overview
Members of this largest group have at most a high school diploma (or equivalent), and 44 percent did not complete high school. They are nearly all “prime age,” between 25 and 54 years old. The plurality is Latino, and nearly half were born outside the United States—although two-thirds of all members are U.S. citizens. A large percentage are English language-learners and over half speak a language other than English at home. Half are married and a third are supporting a child under 18 in their home. Compared with other groups, this group shows moderate levels of interest in work.
Effective practices for this group![]()
BP
TJ
SE
JS
SI
2G
AP
AS
Meet Joseph and Carmen

Joseph is a 51-year-old white man with a high school diploma. He last worked two years ago doing construction, and gave up looking for work about six months ago; construction has slowed down in his economically depressed area. He is single and lives with his brother and his family.

Carmen is a 40-year-old married mother of teenage children. A green card holder, she immigrated to U.S. when she was very young, and never completed high school; she prefers to speak Spanish at home. She has been thinking about looking for work to help support the family, whose income is just above the poverty line.
Overview
Members of this group were least likely both to be actively looking for work and to have worked in the previous year. Nearly all are over 55 and may be eyeing retirement, but are not receiving retirement or disability benefits. They are the least likely to be caring for children in their home. All completed at most high school; they are the most likely to report some form of disability; and just 61 percent speak English “very well,” the lowest rate of any group. Nearly half were born outside the United States, although 73 percent of all members are U.S. citizens.
Effective practices for this group![]()
BP
TJ
SE
JS
SI
2G
AP
AS
Meet Lola and Valentina

Lola is a 61-year-old Filipina immigrant; she is not a citizen but is in the United States legally. She never completed secondary school and does not speak much English. She used to work as a hotel housekeeper, but stopped nearly 10 years ago as her vision deteriorated.

Valentina is a 58-year-old married former home care aide. She is a U.S.-born Latina with a high school diploma. She stopped working five years ago to help care for her grandchildren, who do not live with her.
Overview
This group has the highest rates of actively looking for work, and of school enrollment. They are in the beginning of their prime working years, at median age 33. Those in school are “nontraditional” students actively looking for work. All members have completed at least some college, and may have an occupational certificate or Associate degree. The majority are native-born and English-speaking. They have the second-highest rate of caring for children under 18, about the same as the less-educated prime-age group.
Effective practices for this group![]()
BP
TJ
SE
JS
SI
2G
AP
AS
Meet Carlos and Anna

Carlos is a 42-year-old second-generation American. He is single. He dropped out of college after his first year, and since then has mostly worked in retail and as a product promoter. He has not worked in the past 18 months while trying to get his business off the ground.

Anna is a 31-year-old single mother of a young daughter. She recently quit her home health aide job to find work with hours that will allow her to study to become a licensed practical nurse. Food stamps and public assistance are meager, but keep her afloat during this transition period.
Overview
All members of this group completed at least some college and at most an occupational certificate or Associate degree. Over half are 55 or older, and three-quarters are over the age of 46. This group is overwhelmingly native-born, white, and English-speaking. Perhaps related to their older-than-average age, an above-average share of this group reports some form of disability. They report moderate family incomes and moderate work engagement relative to the other groups.
Effective practices for this group![]()
BP
TJ
SE
JS
SI
2G
AP
AS
Meet Jacqueline and Bernadette

Jacqueline is a 57-year-old white woman who left college to get married and start a family. Five years ago she left her job as a teacher's aide to care for her parents, who have since passed away. She is divorced, and has grown children; she lives alone.

Bernadette is a 52-year-old black woman with an Associate degree. She left her job as an office manager two years ago to recover from a serious car accident; she still has difficulty walking. She is now looking for similar work to help contribute to her and her husband's retirement.
Overview
Among all groups, members of this group were the most likely to have worked in the previous year, and they have the second-highest rate of actively looking for work. They are the least likely of any group to report some form of disability. All members have at least a Bachelor degree and relatively high median family income. This group is predominantly white and Asian; 39 percent were born outside the United States. Over half are married, and a quarter are married with children—the highest rate of any group.
Effective practices for this group![]()
BP
TJ
SE
JS
SI
2G
AP
AS
Meet Anika and Doug

Anika is a 32-year-old who moved to the United States from India six years ago to pursue a Ph.D. She did not work while she was in school, but is now looking for a job doing pharmacology research. She met her husband in graduate school and was recently naturalized.

Doug is a 43-year-old information technology systems manager who was laid off in the past year. He will look for work soon, but is not in a hurry; his wife works, and he would like to as well.
Overview
This is the wealthiest group, reporting median family income of $83,546. Two-thirds are married, the highest rate of any group, but few are caring for children. It is also the least racially and ethnically diverse group, and just 14 percent speak English less than very well. Twenty-nine percent were born outside the U.S., but like all members of the group, all possess a Bachelor degree or higher; and 88 percent of all members are U.S. citizens. They show moderate interest in work, comparable to that of the largest group of less-educated prime-age workers.
Effective practices for this group![]()
BP
TJ
SE
JS
SI
2G
AP
AS
Meet Leonard and Moira

Leonard is a 54-year-old white man who last worked three years ago as an accountant. He is not looking for work, as his wife's job can support them both, particularly given that they do not have children. He would like to work if the right opportunity came along.

Moira is a 57-year-old white woman with a Bachelor degree in speech pathology. She is married and has not worked in five years, unable to find a job where they moved for her husband's work. They do not have children.
Explore the out-of-work population in the 130 study jurisdictions
Select a jurisdiction
Distribution of major out-of-work groups in all jurisdictions
Select a segment to view underlying data
Data visualization produced by Alec Friedhoff.
Authors


The Brookings Institution is committed to quality, independence, and impact.
We are supported by a diverse array of funders. In line with our values and policies, each Brookings publication represents the sole views of its author(s).